Production Possibility Curve
Here, we understand the concept of Production Possibility Curve in detailed with diagram.
Do you have similar website/ Product?
Show in this page just for only
$2 (for a month)
0/60
0/180
Production Possibility Curve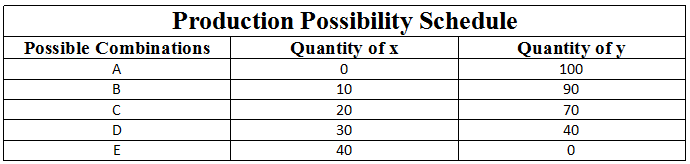
The production possibility curve is known as production transformation curve or production possibility frontier.
Production possibility curve is a graphical presentation of alternative production possibilities facing an economy. It is defined as a curve indicating all those combinations of two goods which an economy can produce under a given situation of fixed resources and technology.
Now, we will discuss about its Assumptions in detail:
Assumptions of production possibility curve:
It is based on following assumptions as follows-
- Only two goods ( x and y ) are produced in the economy.
- Total supply of the factors of production is fixed and constant. But factors of production can be shifted freely between x and y.
- All factors of production are fully employed in the economy. Means, Unemployment is non-existent.
- Production technique is given and fixed.
This schedule shows that, with given resources and technology, economy can produce combination A or B or C or D or E. It have 100 units of y and zero unit of x if all resources are used for the production of y only. Conversely, it can have 40 units of x and zero unit of y if all resources are used for the production of x only. In between, there are three combinations of x and y which are also available to the economy.
This schedule indicates that an economy moves from A to E, production of x increases, while that of y diminishes. Resources are scarce and fixed, it is not possible to increase the production of both x and y.
It clearly indicates that production possibility curve is described as production transformation curve. When the economy moves from A to E, it transforms y commodity into x commodity by shifting resources from Y industry to X industry.
We can obtain a production possibility curve by placing the above schedule on a graph.
Figure -1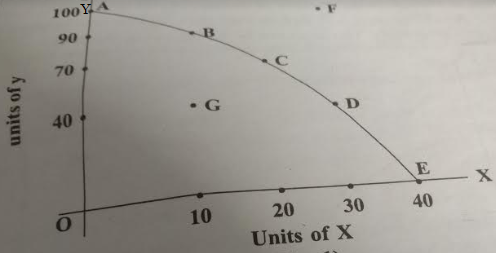
As shown in above figure, all possible combinations of x and y are represented by points A, B, C, D and E. By joining these points, we obtained smooth downward sloping curve AE. This is production possibility curve showing that the economy can produce any of the combinations lying under the given situation of resources and technology. Any combination lying inside AE curve such as G is obtainable but it would never be preferable because at this point resources are not fully utilised.
CONTINUE READING
Production possibility curve
Production transformation curve
Production possibility frontier
Fixed resources and technology
Two goods produced in economy
Factors of production is fixed and constant.
Production Possibility Curve
Kinnari
Tech writer at NewsandStory